Menu
Articles /Pin to ProfileBookmark
How To Project Organic Search Traffic And The Cost Of Acquiring It

(Editorial note: I originally wrote this post over on the Hit Subscribe blog. I’ll be cross-posting anything I think this audience might find interesting and also started a SubStack to which I’ll syndicate marketing-related content.)
Today I rolled up my sleeves and made a spreadsheet. I know, I know, try to contain your jealousy.
But in all seriousness, it was an interesting exercise. A client of ours was interested in assessing the relative cost of a few scenarios. Specifically, they wanted to know the cost of the following:
- Sustaining the traffic with periodic new content and content refreshes.
- Increasing the traffic by 50% over one to two years.
- Increasing traffic by 100% over the same period.
Never one to back away from a Fermi problem, I figured I’d extend our modeling library to cover this scenario. If nothing else, it’d be good practice for a future hypothetical job interview to show some too-clever-by-far interviewer “how I think.” I kid—if an interviewer ever asked how I think, I’d show them a gif of a hamster running on a wheel.
Anyway, I now have this utility in hand, so I thought it might be interesting to share. I’ll go through the thinking and the methodology here, and I’ll link to a Google sheet that you’re welcome to use for your own modeling. And incidentally, the numbers that I’m using in this post are made up and not related to the client that asked for this (or any other specific client).
Organic Modeling in Concept
Let me first explain the idea here at a somewhat foundational level for starters. Here are some basic principles to understand.
- Search traffic to your site is not more than the sum of its parts. It’s a collection of URLs, each of which earn some amount of monthly traffic, and the sum of the traffic to those URLs is the total traffic to your site.
- When you publish a piece of content to a URL, it has an organic traffic lifecycle. It will earn zero traffic for a period of time before it starts to hit page one and earn traffic. It will typically ascend for some period of time, peak, and then slowly decay.
- Your site’s traffic will, holistically, decay by some percent over time.
- It is generally easier (and more cost effective) to sustain traffic, but significant growth requires new content.
So the task with modeling here is twofold. First, we need to reason about existing traffic and its rate of decay. And secondly, we need to combine that with the rate of growth associated with net new content over a period of time.
Defining Our Variables
A trick I picked up during my management consulting days was to make all of your assumptions in a model big and visible by using them as variables that the stakeholders could play with. So, for instance, if I don’t know what kind of conversion rate a client’s website has, holistically, I assume it’s 1%, but I make conversion rate a variable in the model.
The idea is that you don’t want to make the discussion about your assumptions but rather about their insights and modeling preferences. If I make 1% a variable, then if a client says, “One percent? That’s ridiculous. Why would you think that?!” I can respond with, “I didn’t. It’s a wild guess. Let’s change it to whatever you prefer.”
With this in mind, here are the assumption-variables for modeling a client’s organic traffic.
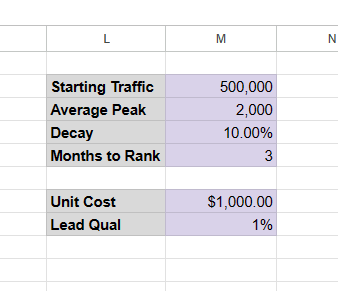
The Nitty Gritty
- Starting traffic is crucial to understand and easy to measure with analytics. For the sake of round numbers, the example I’m using here is half a million per month.
- Average peak traffic is how many visitors we can expect per month per piece of content. If you have a decent amount of traffic already, just take the top N articles and average them as a starting point. Absent that, guess, since we can feed field data back into the model later.
- The rate of decay is how much traffic the site will lose per month if you do nothing. Decay tends to increase substantially as a function of how much traffic the blog has. (One thing to note here is that my initial decay model is somewhat unsophisticated as simple exponential decay, where the slope of decay should probably vary with original size.)
- “Months to rank” is our variable for how long before the average article ranks in a position to earn traffic. Again, this initial model is (over) simple in that there should be a gradual run up from zero to peak traffic instead of the binary that I’ve started with. That said, playing with months to rank gives you proxy control over things like domain authority, keyword stats, etc.
- Unit cost is what you’ll spend per piece of content.
- Lead qualification is how many of these visitors become identifiable, qualified marketing leads.
All of this as input, along with the content production volume, allows us to play with figures to model out different traffic situations.
Modeling the Traffic and Cost
Here’s the rest of the worksheet, with a content publication plan aimed at a 50% growth figure within two years.
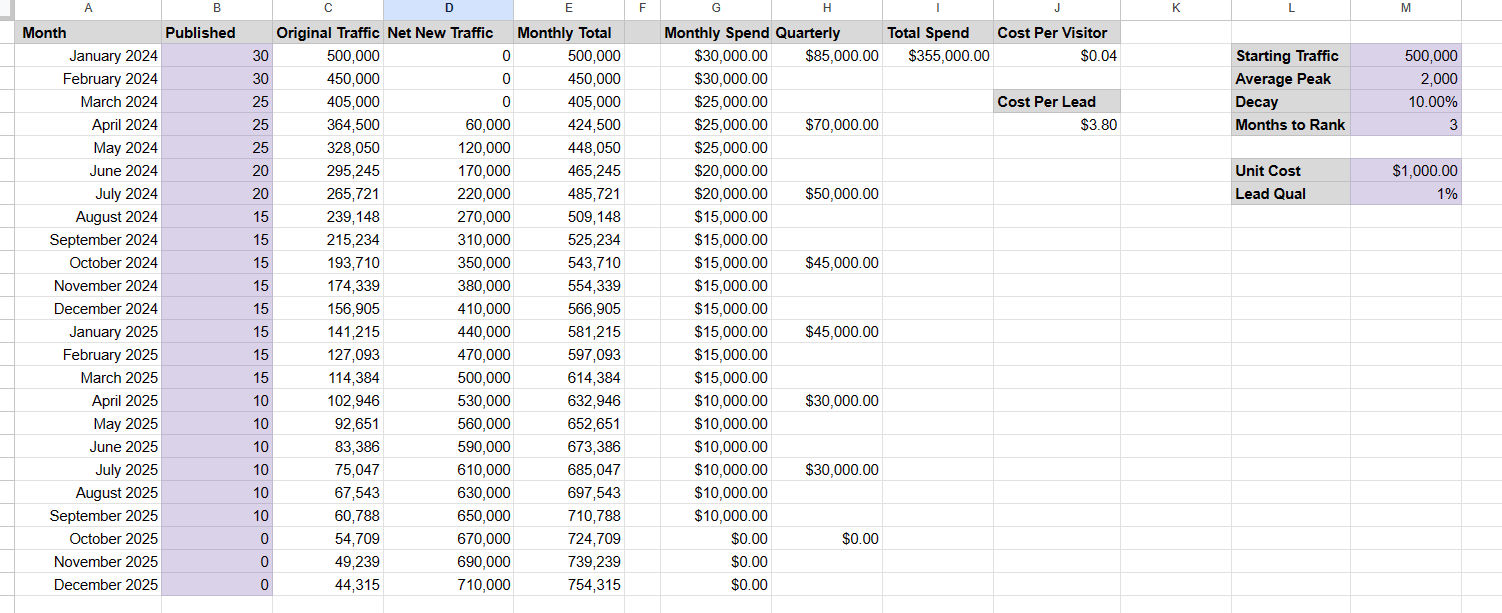
I won’t go into the actual formulas since you can get into those weeds all on your own with the sheet I’ll link below. But a few things to note here:
- Everything in purple is an input, which you can play with.
- If you want more than two years worth of data, you can just drag everything down.
- You can see the earned traffic decaying month over month by the 10% we’ve scoped out in the assumptions panel. (This is a very high rate of decay)
- Likewise, you can see the growth of net new traffic, with the three-month delay in rank being obvious.
- The total traffic is the combination of new traffic and non-decayed traffic earned from historical content.
- All of the customer-acquisition-cost-related data stems from the unit cost of these pieces of content.
For getting this hypothetical website from 500K to 750K visitors, I just kind of played with a front-loaded approach with roundish numbers until that final total hit the goal. This is the most common approach with any of our models when someone asks, “What would it take to get to X?” But you could just as easily pick a unit cost and plug in what a budget allows and see how much traffic you can make happen.
A Second Scenario
To get a feel for how you can play with something like this, let’s imagine that this hypothetical site owner wanted to change the inputs. “Woah, I bet we can get away with $400 per article if we run a Digital Ocean type of program, and I bet we can get our decay rate down with some cost-effective refreshes. Could we get to a million visitors with a similar budget?” (I plan to add refreshes to the modeling later)
Okay, fair enough. Let’s look at that.
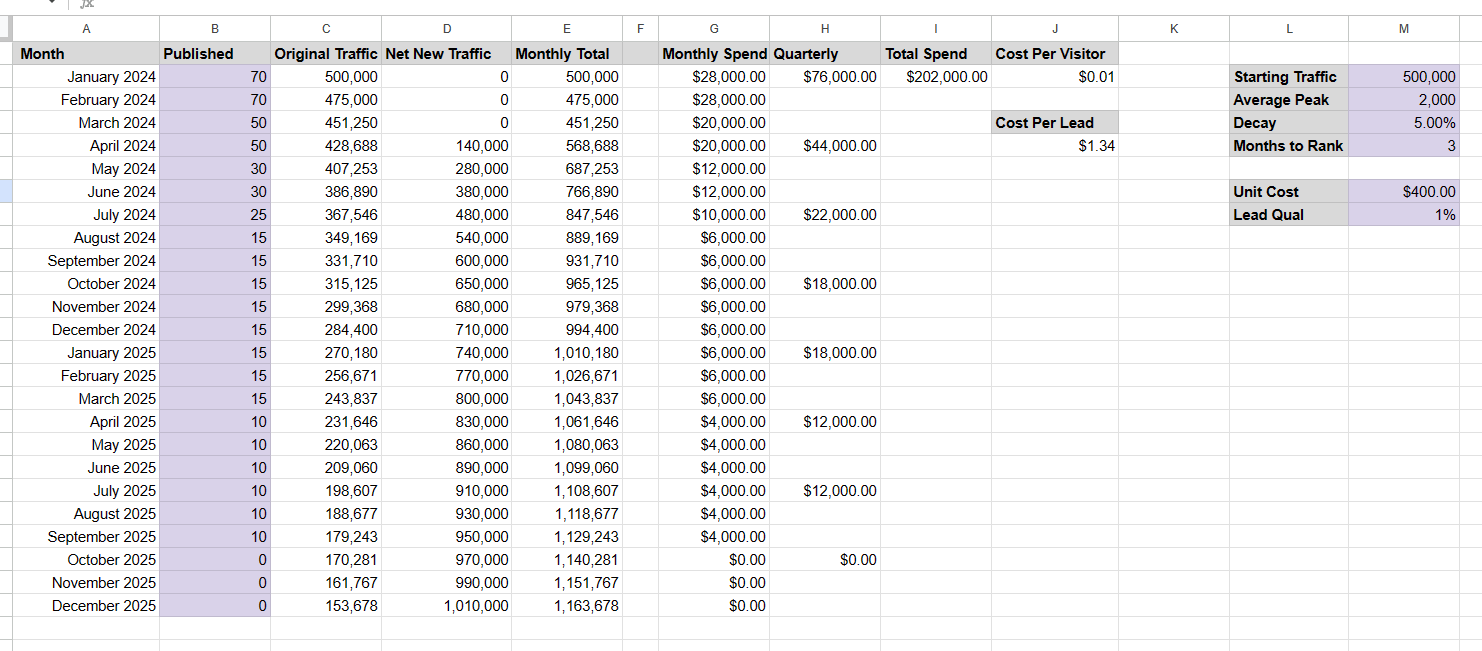
Good news, hypothetical site owner! Bring your decay down to 5% and your unit cost down to $400, and not only can you hit one million visitors per month for WAY under the previous outlay of $355K, but you can move up your timeline by a year.
Of course, this doesn’t address other program-related questions, such as whether you’re even able to ramp up to seventy articles per month or whether having a spiky budget is doable. But that’s the point of the modeling tool. You can fix the things in place that you can’t control, play with the rest, and see what’s possible.
Using This Tool
That actually makes a good segue into how I’d like to conclude here: suggestions on how to use this.
If you have a particular BHAG or KPI around traffic or conversions, you can start with that and work backward to a fulfillment schedule, acceptable cost, and operational goals around decay and peak traffic. But that’s not what I’d suggest for the average person using this.
Instead, I’d plug in as many actuals as possible (how much traffic do you have, how many visitors does the average top content peak at, how many articles are you actually producing, how much are you actually decaying), and see what the model projects for you in the coming years. If the traffic and CAC figures that result look good to you, great!
If not, then start playing. Could you nose up peak monthly visits? Ratchet down decay rate? Source a few more articles? Expand the budget? What kind of impact might each of these things have?
In the end, I think this can be a helpful tool around budget time for a lot of folks. You can use it to make the case that the funnel metrics the leadership team wants are way out of whack with budget, or more optimistically, that you’re actually on track with your goals and that folks need to have patience.
But the most important thing of all is that you need to feed measured data back into the model as you go. The model is only as good as its assumptions, and you can steadily improve those.
Hopefully this helps. Here’s a link to the sheet, which you can copy and feel free to use.